Sparkline
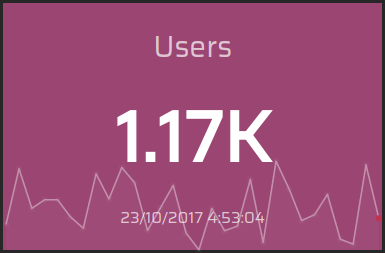
The sparkline widget is to help quickly visualise the history of a metric. The widget plots all supplied values on a sparkline line chart as best as it can. The last value provided will be assumed as the most up to date value to display.
Usage
import SparklineWidget from '../widgets/sparkline/widget';
  <SparklineWidget
    name="DemoUsers"
    title="Users"
    format="0.00a"
  />
Props
| Prop | Description | Required |
|---|---|---|
| name | Name of widget. Used to update the widget when a job completes | Yes |
| title | Title of widget. Usually displayed above the metric value | Yes |
| format | How to format the widget value. See Numeral docs. | Optional |
Data Stucture
When building a job for the sparkline widget, the value entry should be an Array of multiple data points for the sparkline graph to plot. The last value provided is assumed to be the latest value:
  data: {
    value: [
      1144,1425,1223,1267,1267,1180,1122,1399,
      1271,1431,1353,1111,1225,1340,1098,1012,
      1223,1109,1133,1371,1050,1463,1324,1161,
      1191,1294,1066,1041,1445,1172
    ]
  }
Example